Iconosquare Review
With over a billion connected users, Instagram is one of the most used social networks in the world. In light of these numbers, the platform has become attractive for many sectors such as catering, fashion, tourism and even brands, large or small, cannot do without it. To facilitate its use there are various software among which we find Iconosquare, a web platform for Instagram that offers statistics and useful information about your account and more generally about all the social networks you use.
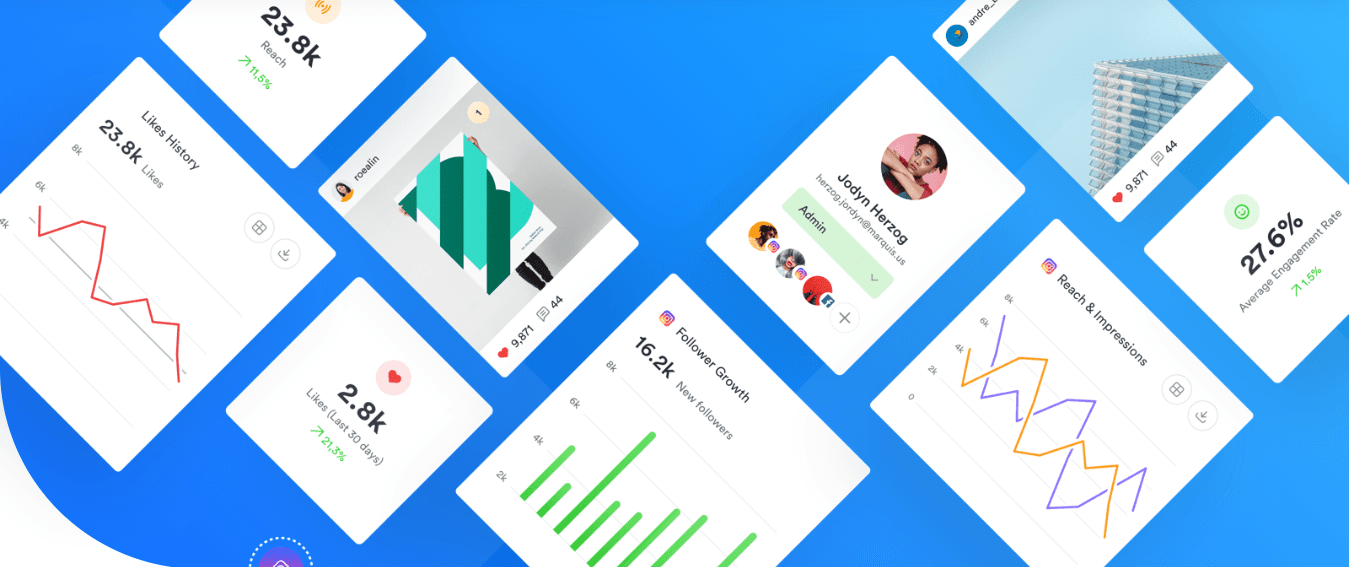
Specifically, Iconosquare is a scheduling and monitoring social media that works specifically for Instagram and, more recently, also for Facebook. This tool provides users with detailed graphs and statistics on followers, likes, comments, on how many photos have been taken and which are the ones that have obtained the most consensus strong>.
To date, Iconosquare is one of the most used platforms in the world with over 10 million users, but let’s see what it is.
How Iconosquare works
Using an advanced set of features, users can gain valuable insights into their account performance and their audience. Once logged in, all this information will be available in the Analytics tab. The first screen provides a general overview containing all the key stats that need to be monitored on a daily basis, including:
- Total Followers;
- Impressions;
- Reach;
- Average engagement rate by post;
- Most recent media from;
- Most recent stories from;
- Followers gained and lost.
It is possible to select a time interval so as to be able to choose whether to look at the data over a broad period of time or to restrict the field to one day or a particular week.
Let’s analyze some features in detail.
Best time to post
A section that you need to pay close attention to is “Best time to post”; in fact, due to recent algorithm updates, Instagram no longer shows posts in chronological order, but based on the engagement rate. Iconosquare, thanks to the support of some graphs, shows users which is the best day to publish a post and in which moments the public interacts most with their content. p>
Most engaging posts
As anticipated, engagement is very important for Instagram and thanks to this tool you can see which are the favorite contents of your followers, so that you can also replicate them in the future, and which posts create more engagement in a given period of time.
Identify post’s “Lifespan”
Most Instagram posts get high engagement rates immediately after posting and then slowly decline. “Lifespan” allows you to see when a single post has gotten the most engagement and its performance starts to lose effectiveness.
Community stats
Iconosquare offers users a clear breakdown of followers, displaying details such as geographic location or demographics. Then there are advanced features that allow a better understanding of your followers such as “Rolling month analysis” which shows the ten most active users in the last month. In addition, this tool allows us to see which followers fall into the “influencer” category opening the door to possible partnerships or influencer marketing campaigns.
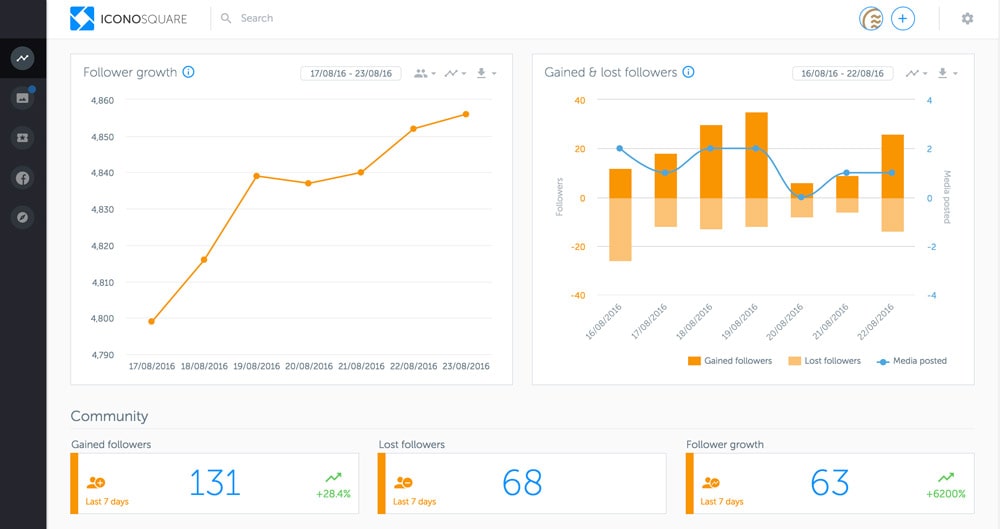
Gained and lost followers
Each social network is subject to a fluctuation in followers, even if to obtain consistent growth it is enough to keep your feed constantly updated. “Gained and lost followers” allows you to monitor the progress of followers by reporting any peaks in growth or loss.
Hashtag tracking
This function offers a complete analysis of the performance of a particular hashtag on Instagram, including detailed information regarding the number of likes, comments received and the number of posts in which the hashtag is present. ‘hashtag in question. It also allows you to identify the most influential posts and users who use a particular hashtag, so you can create an effective hashtag strategy that also identifies related ones and see what types of posts they are associated with.
Competitor benchmarks
Iconosquare allows you to select your competitors and monitor their activity on Instagram and Facebook comparing key metrics such as engagement rate, followers, likes and comments. Furthermore, using some advanced functions it is possible to analyse the growth of followers, their past posts, the hashtags they use and which are the best performing media >. All of this information can help you better plan and execute your strategy.
Instagram stories analytics
The ability to analyze Instagram Stories has recently been added and thanks to this tool, brands can monitor:
- Stories insight, analyzes performance in order to then optimize the strategy;
- New post insight, allows you to understand the reach, impressions and performance of videos over time;
- Demographics, identifies the main audience segments by age, gender, language;
- Followers online, shows when your followers are online.
Manage your content
This Iconosquare function allows you to create separate feeds and each of these can be dedicated to hashtags, influencers and competitors. With the starter plan you can create 3 personalized feeds, while with the pro version you can go up to 5. Through these specific feeds it is possible to monitor posts, likes, comments and anything else you want.< br>This tool also gives you access to “Iconosquare’s comments tracker” which allows you to keep track of all post comments and reply to your followers in real time. Furthermore, it is possible to flag comments already read so that they do not repeat themselves.
Finally, with Iconosquare you can schedule posts in advance, saving captions and hashtags to use in the future.
Reports and exports
Iconosquare offers its customers easy to read real data that can be exported to a spreadsheet. By subscribing you can receive daily, weekly or monthly reports by e-mail, as well as a personalized overview of the performance of your account, containing information about the community, the growth of followers , geolocation and much more.
How much does it cost
There was a time when most of the features were free and in reality some of them still are, such as Instagram audit, Brands Index and Influencers Index.
Iconosquare offers its users a period of 14-day free trial at the end of which it is possible to choose between 3 tariff plans.
Let’s see them in detail with the relative monthly billing plans.
- Pro, for small businesses and professionals, $29: offers users 3 social profiles, 2 team members, 3 competitors per profile, 3 hashtags per profile, analytics, industry benchmarks, conversations, planning, XLS reports;
- Advanced, for marketers, $59: offers users 5 social profiles, 3 team members, 5 competitors per profile, 5 hashtags per profile and , compared to the previous plan, PDF report, personalized dashboard, tags and mentions, analysis of sponsored posts;
- Agency, for agencies, for which you need to contact the company to request a personalized plan: it offers users 10 social profiles, unlimited team members, 10 competitors per profile, 10 hashtags by profile and, compared to previous plans, PDF reports for branded companies, customer success program.
PROS
- Provides all the features you would expect to find in an Instagram analytics tool.
- Allows you to get to know your followers and their behavior in depth.
- Easy to read reports and graphs.
CONS
- Does not allow scheduling automatic posts with multiple images.
- A challenging tool to use that takes time to learn.
Features
Gallery
Video
Add Review

Leave a Reply